
Some variation in material is expected and acceptable as long as the same part is produced every time. In this blog, RJG Technologies discusses how second stage speed influences your process and can reduce part variability.
In How Second Stage Speed Influences Your Process: Part 1, we looked at what effects the second stage speed setting has on your specific pressure curves as well as the part weight at different volumetric speeds. Depending on your moulding machine brand and type, this speed setting can also be referred to as hold velocity, hold speed, or pack/hold speed (just to name a few).
As you will notice in figure 1, this velocity setting can affect when the machine actually hits the set pack/hold pressure. Now let’s take a step back and look at the entire picture. As we discuss in our training courses, we like to look at the process from the plastic’s point of view from inside the cavity in order to actually see what is happening to the plastic during these speed changes. In plastics, we can expect to see some variation in the specific pressure curves due to viscosity shifts in the plastic itself. This variation can be acceptable as long as what happens in the cavity is repeatable from shot to shot and year to year.
With a DECOUPLED MOLDING® II process, we are under speed control during the filling phase and allowing the specific pressure to raise or lower to overcome the variation in the viscosity of the material itself. Think of this like the RPM’s on your car—they can go up or down in order to maintain the same speed if the load changes. If you are pressure limited during this portion, it will cause the machine to stall and your fill time will change. Once you transfer over to the pack/hold portion of your process, these roles are reversed. You are now under pressure control and don’t want to be speed limited, which causes the machine to not be able to hit the set pressure in an acceptable amount of time. Keep in mind that while the machine is transferring over to pack/hold, the plastic is cooling and your flow front size is slowing down. This can have a big impact on how well you can pack out the parts to eliminate sinks and overcome shrinkage.
 Figure 1: Second Stage Speed vs. Machine Response
Figure 2 is a graph of a typical DECOUPLED MOLDING II process with a higher second stage speed setting. When you look at the specific injection psi (red curve), you will notice it drops rapidly, then transitions to the lower pack/hold pressure set point. This is what we would expect to see if the second stage speed setting isn’t set too low, causing the process to be speed limited. If you also look at the Post Gate pressure (green curve), you will notice the pressure drops slightly at the transfer point and then starts to rise again when the machine achieves the pack/hold pressure set point. This time will be affected by how full the cavity is when you transfer. Keep in mind that even though the machine achieved the set pack/hold pressure setpoint, the cavity was not full yet, so there wasn’t enough resistance to cause the cavity pressure to rise.
 Figure 2: Increased Second Stage Speed vs. Cavity psi
Figure 3 shows a graph of a typical DECOUPLED MOLDING II process with a lower second stage speed setting. When you look at the specific injection psi (red curve), you will notice it drops rapidly but then takes an excessive amount of time to transition to the pack/hold pressure set point. This is because the machine’s second stage speed is set too low, which is causing it to be speed limited and restricting the machine’s ability to achieve the desired pack/hold pressure in an acceptable amount of time. The graph also shows that it takes twice as long before the cavity psi curves reach peak cavity psi. We were originally hitting around 3300 ppsi for peak Post Gate pressure, but with the slower speed, it is only achieving around 1900 ppsi. This is a 42.42% decrease in peak Post Gate pressure. With this big of a shift, you may start to see sinks and dimensional changes in your part.
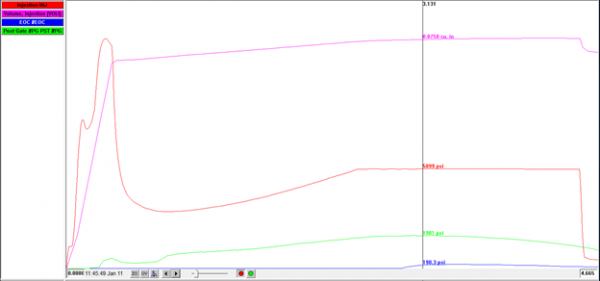 Figure 3: Slower Second Stage Speed vs. Cavity psi
Both figures 2 and 3 had the same fill time, cushion, pack/hold set point, and peak shot volume. One may ask: how is it possible for both cycles to use the exact same volume of material but still have different pressures in the cavity? This part was a cold runner tool, and even though the plastic in the cavity was freezing off, the runner was still able to be packed. So you could potentially be running parts with sinks and smaller dimensions, but you are also scrapping more material with your cold runner. That means potentially losing money not only on rejected parts but also on more material being scrapped with the cold runners (unless you regrind and reuse it).
The cycles in figures 2 and 3 also both hit Post Gate psi at the exact same time of .30 seconds. This shows that the filling phase of the process did not change. In figure 2, the cavity pressure doesn’t hit the End of Cavity sensor until .96 sec, which gives you an in-cavity fill time of .66 sec. However, in figure 3, it doesn’t see pressure on the End of Cavity sensor until 2.92 seconds, which gives us an in-cavity fill time of 2.62 seconds. This is a 296.97% increase in the in-cavity fill time. Imagine if this was a thin-walled part and you slowed down the flow front and transferred before the cavity was full. You may never finish filling out the cavity because the flow front is frozen and stalled. In figure 4, you will see data from the process comparison between the samples in figures 2 and 3.
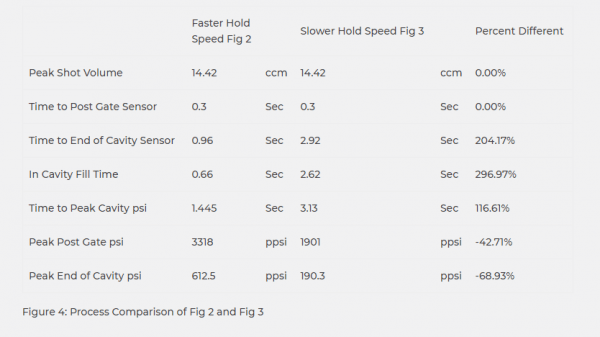 Figure 4: Process Comparison of Fig 2 and Fig 3
Of course, not all processes are the same, so the second stage speed setting may affect different mould, machine, and material combinations differently. But as you can see in this scenario, by only changing the second stage speed setting, we drastically changed what was happening in the cavity. So the next time you think about adjusting the hold speed setting, make sure you look at the big picture and think from the plastic’s point of view.